A social media account with 100,000 followers just posted a warning on X that the monthly RSI of SPX is in overbought territory.
We checked the data on this and it turns out that currently the monthly RSI has been above 70 for 6 months in a row.
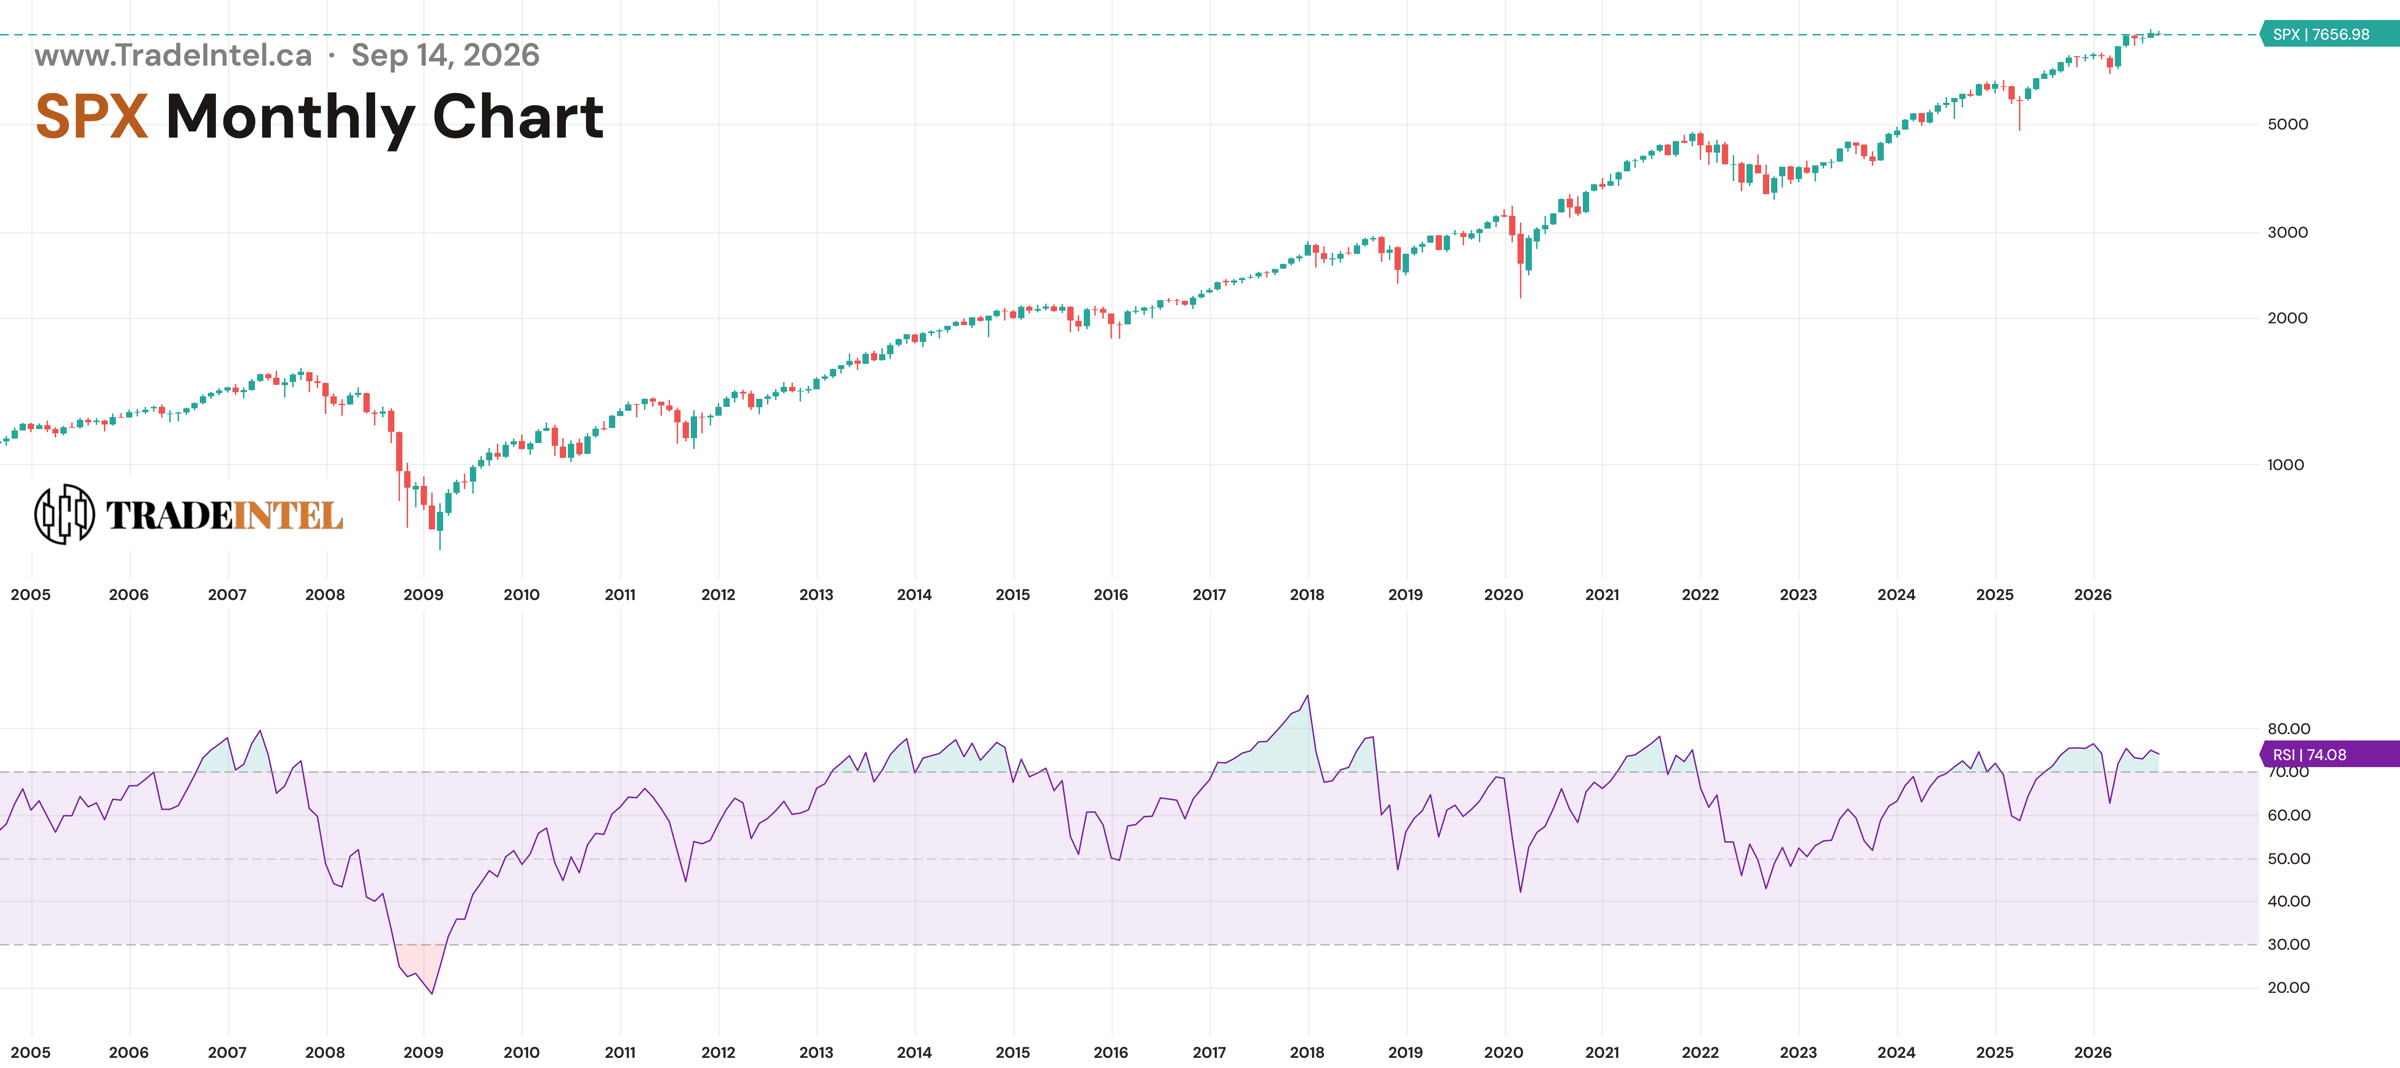
The first thing our backtest revealed is that SPX has closed a month with RSI above 70 in 162 of 666 months, which is 24.3% of the time.
Roughly 1 month in 4 is in overbought territory. That alone should make anyone cautious about calling it a top signal.
Here is every run that reached 6 months, and what SPX did in the month that followed.
| 6 month run | 7th month return |
|---|---|
| Mar 1983 - Sep 1983 | +1.02% |
| Nov 1985 - May 1986 | +5.02% |
| Jan 1987 - Jul 1987 | +4.82% |
| May 1995 - Nov 1995 | +4.10% |
| Oct 2006 - Apr 2007 | +4.33% |
| Feb 2014 - Aug 2014 | +3.77% |
| Feb 2017 - Aug 2017 | +0.05% |
| Mar 2021 - Sep 2021 | -4.76% |
| Aug 2025 - Feb 2026 | -0.87% |
| Apr 2026 - Sep 2026 | (next month) |
The 7th month averaged +1.94%, with a median of +3.77% and 7 of 9 closed green.
That is a lot of strength at a time when traders might think 6 months in overbought territory is a warning sign.
Comments
Loading comments…